
Archived Project

Decomposition
Data Visualization ● 2017
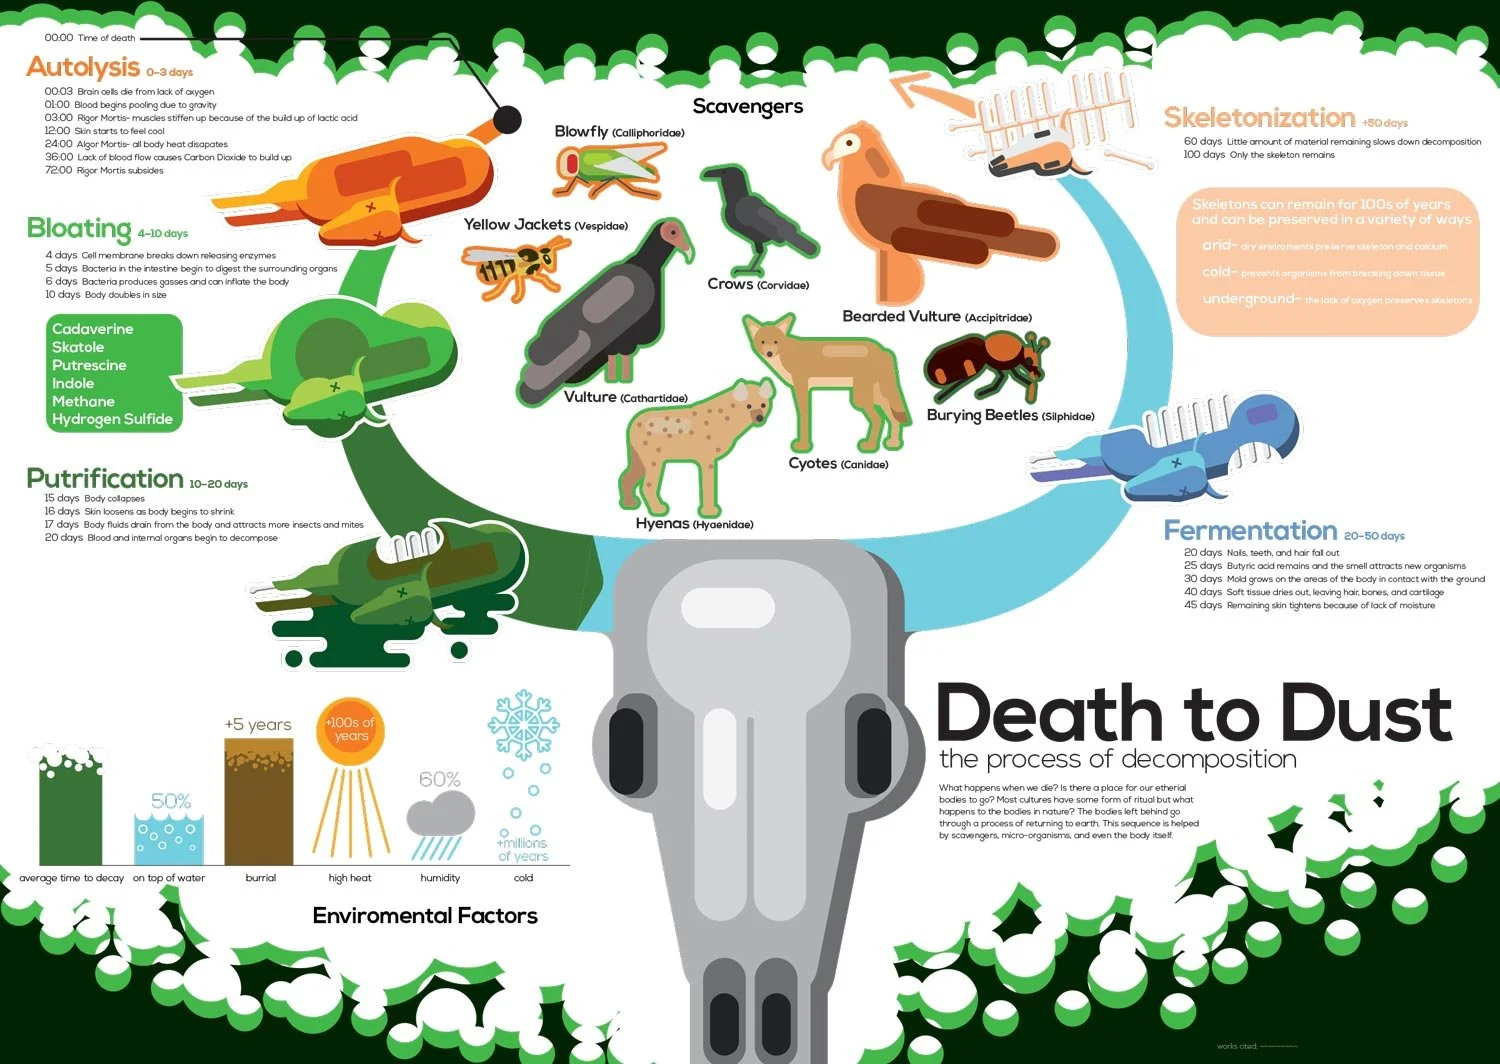
A data visualization project focused on analyzing a process and breaking down the steps. The subject of decomposition was chosen as a challenge to show something unappealing in a visually interesting way. A visual language was developed to convey the information effectively.

Visual Language
In order to make the subject of decomposition a visual style was created. It draws inspiration from several information distribution sources, focusing on solid colors and geometric shapes.


The Poster
The visual language was then applied to the poster, which went through its own process of development.


Archived Project

Ebola and the Flu
Data Visualization ● 2015
A data visualization project where data and information was gathered from several sources. It was then analyzed and cross-referenced to create a graphic. The project compared the infection rates of Ebola and the flu along with the differences in fatality rates and the chance of infection over time.

Data
Data and information was gathered from multiple sources and compiled. It was then analyzed to find trends and differences of interest.


